


Bonds USA
July 9, 2024 - Bonds have initiated a BEAR TREND = we expect HIGHER Interest Rates worldwide!
 |
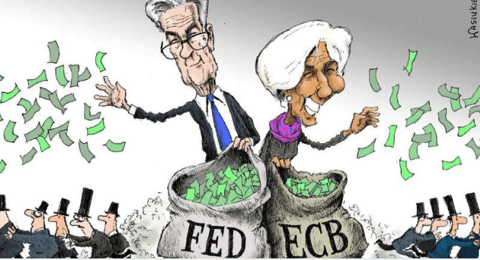
An accident waiting to happen. A time bomb: Interest rates will continue to rise, and if they don't, it will be because of a financial crash (Feb 2024)! The Central Banks of Europe and the FED are coordinating their monetary policies. (April 2024) Interest rates will continue to rise, even during the future regime of MORE Money Creation (QE). The bond market has been showing a BEAR TREND...since 2011, and natural market forces are not taking over yet!?. |
||
|
|||
As Seen in History - what happened in Greece (and Turkey, and Venezuela) is a perfect example of what is to happen with other Treasury Bonds: when the bubble bursts, most of the time, it's too late to act - Five past twelve to move out of Fixed-interest instruments & financial instruments based on bonds (incl. TAK and other bank manufactured products) and into Real Assets (incl shares but excl. Real Estate and ex. financial shares, pension funds, (re)-insurance co's). This wholly MANIPULATED market will be the coffin of many Fortunes...Treasuries = Credit Default Swaps = Bank manufactured products = saving accounts = bank deposits; what good does it do to be safe when, on day 1001, you are slaughtered!?.
 |
 |
| Vanguard Total Bond Market: STOP LOSS & Backtest done = expect LOWER bonds and HIGHER INTEREST RATES. (May 2023) |
High Yield Corporate Bond: INSANE! |
| Interest Rate is the derivative of Money Supply...it is impossible to regulate the economy by RIGGING the interest rates (like Central banks try today). |
The Bond market is one BIG Bubble and a BEAR TREND...A DRAMA will unfold if Central Banks reverse QE...and Central Banks have decided for QE4...
- Interest rates are bottoming (2020), so beware of the marginal maximum interest rate levels. The marginal levels are between 1% and -1%, depending on the currency. Hell will break loose once interest rates break these levels to the upside.
- The 35-year interest cycle peaked in 1981 and bottomed in 2016, as the US 10-year Treasury Note chart below shows. The current yield of 1.59% is not far from the low, but momentum indicators have not confirmed the recent fall in rates. Thus, the chart indicates a bullish divergence and the potential for rates to increase from here. Our proprietary cycle indicators confirm that move.
- But whether rates go up from here or slightly later is less critical. What is certain is that central banks will lose control of interest rates as bond markets collapse and yield surge when money printing takes off in earnest.
- The current belief in flight to “safety” by holding government bonds is absolutely ludicrous. At some point in the next year, investors will exit bonds at any price. Nobody will want to hold a toxic instrument issued by a bankrupt government that can neither afford to pay the interest nor the capital without issuing more worthless bonds. Ultimately, we mostly have a Debt Moratorium like in Belgium after WW2.

ʘ ʘ ʘ 30-year US Treasuries: a bear trend it is!
| 30-year US-Treasury Bond price | |
| Bullish Objective | we have "4" historic tops and a bubble!.... |
| Resistance | 128 |
| Support | 108 |
| Bearish Objective | n.a. |
| Technical pattern | SOLID BEAR TREND |


ʘ ʘ ʘ 30-year US Treasuries Yield - % - a Solid BULL trend!
 |
| Short term Candle | Chart comment |
 |
|
| Long term Candle | |
 |
ʘ ʘ ʘ 10-year US Treasuries.
10-Year Treasury Bonds: A Bull Horn, broadening action suggests that a market is OUT of CONTROL!
 |
|
| Short Candle | Comment |
 |
|
| Long Candle | |
 |
|
ʘ ʘ ʘ 10-year US Treasury yield: Target is 7%
 |
|
| Short Candle | Comment |
 |
|
| Long Candle | |
 |
|
ʘ ʘ ʘ - Municipal bonds are now also bought by Central Banks (FED).
| The Federal Reserve, the Federal Deposit Insurance Corporation, and the Office of the Comptroller of the Currency changed the liquidity requirements for the nation's largest banks. Municipal bonds, long considered safe liquid investments, have been eliminated from the list of high-quality liquid collateral. Assets. That means banks that are the largest holders will have to dump them in favor of the Treasuries and corporate bonds that satisfy the requirement. |
March 2016: Less than a week after the ECB’s announcement and months before it is to actually buy any bonds, a new record for a euro-denominated corporate bond issue was set on Wednesday when brewer Anheuser-Busch InBev said it was seeking to raise 13.25 billion euros ($14.9 billion).
Credit analysts at Dutch bank ING wrote in a note to clients, “In our view, this highlights the current positive backdrop for primary issuance induced by the ECB’s new easing measures, " particularly the new corporate bond program.
The corporate debt market has benefited indirectly as ECB purchases of government bonds have pushed investors into the corporate market, lowering borrowing rates. In addition to the corporate bond purchases, the ECB also announced a program to pay banks if they step up their lending effectively earlier this month.
 |
| Short term candle | Chart comments | |
 |
|
|
| Long term candle | ||
 |
||
Interest Rates have never been so low since the 15th Century (2021-22).
- Interest Rate is the derivative of Money Supply...it is impossible to regulate the economy by RIGGING the interest rates (like Central banks try today)
- Interest Rate cycles are 60-70 years long: 30-35 years up and 30-35 years down.
- Interest rates will rise, AND so will GOLD! Since 2001, it has been safer, and the yield has been better for those holding gold than bonds. Or how to lose 70% or more of your savings in a couple of years only by holding on to Bonds.
- Bonds are certificates of guaranteed confiscation (Ludwig von Mises) and the safest way to lose your savings.
- Remember, the Top for Bonds was seen last year, and cycles are 37 years long. Bonds will indicate the beginning of hyperinflation.
- Did you notice how fast Greek interest rates increased from 3% to +10% in only a week?? The 2009 bond crash started in Europe (Greece) last February 2011 and started in the USA, and it has received increasing media coverage. Thanks to what is happening in Europe, the bond crash in the USA has been delayed.
- The FED, the ECB, the BoJ, and the Bank of England have become the largest single debt buyers. Quantitative Easing is monetary inflation; such a policy always results in worthless money, worthless bonds, and higher interest rates.
- If the PF chart shows no Trend Reversal, one should not touch Bonds and Treasuries. Not even with a 10-yard stick.
- The first phase of the banking crisis has only wiped out bank equities; the second phase is to wipe out deposits, but the last phase will wipe out bondholders, bank equities, and deposits, ...once the Bond market wakes up, it will be a GAME OVER!
 |
 |
| 1981 was a historic top, and 2017 is a historic bottom | Click to enlarge |
 |
 |
 |
To the left is the law of supply and demand of Money...or how the price of Money (Interest) is regulated in an open system. The following rules stop working in times of Hyperinflation:
|
 |
 |
| Click to enlarge |
10-Year Treasury Bonds in Gold ---A CRASH IT IS! ...80% loss since 2000 or 10% loss each year. The downtrend resumed in September 2017. This is a CLEAR, almost SPOTLESS downtrend...or Gold becomes the ultimate Barbaric money, and Bonds and Treasuries worthless. |
This is the section where we have been completely wrong (at least for the USA and the EU, where the FED and the ECB have been able to avoid the worst) because no crash has happened so far. This does not mean, however, that a CRASH can happen at any time. Having said this, the TIMING is wrong..the technicals and the fundamentals, however, are not!
|
|

 Pension funds and (re)Insurance companies must invest the bulk of their assets in Treasuries by law. Pension funds and (re)Insurance companies must invest the bulk of their assets in Treasuries by law. |
The Treasury SELL-OFF has already begun... |
||
| CENTRAL BANK PANIC MODES | |||
 |
 |
||
| 30 y Gov. bond yields UK, EU, US (60-year cycles) | Click here for more Bond charts: Italy, Greece, Spain,... | ||
 |
 |
||
| Negative Nominal Interest Rates REDUCE the Money Supply and increase its intrinsic value. |
The PF and Long term candle charts below are of capital importance as well as the 3% threshold! The higher the debt, the lower the critical level; for Japan the critical level is 1%.
Hyperinflation occurs when a country’s bond market breaks. In other words, the sovereign nation can no longer fund itself. Its bonds fall (yields rise) to the point where the government has to print money or default. Rising interest rates cause interest payments to consume too much of the overall budget. The government or central bank then begins to print money to fund its deficit. Then, the citizens start to consume, knowing that the currency is rapidly losing value. Demand has nothing to do with the cause or the onset of hyperinflation.
 Why didn't Japan have hyperinflation in the 1990s? It didn't have to monetize its debt. It had the internal savings needed to finance its budget. The same thing was confirmed in the United States in the 1930s. Even though we devalued the currency, the bond market remained strong into the early 1940s, thus preventing runaway inflation.
The breaking of many bond markets globally is the catalyst for severe inflation. The UK, Japan, and the US cannot finance their budget gaps without monetization. The budget deficits are now more significant due to reduced global liquidity and tax revenues. Global monetization will lead to severe inflation and hyperinflation.
The other point about severe hyperinflation is that it doesn't rise steadily. The preconditions and causes are subtle as hyperinflation occurs suddenly or dramatically. ..click here for more fundamentals
ʘ ʘ ʘ - TBT is an instrument for shorting Bonds.
| This is a manufactured financial instrument to SHORT bonds (we don't like it!) | |
 |
|
| Short term Candle | Comment |
 |
|
| Long term Candle | |
 |
|
 In a system of Real Money (Gold and Silver), it is the Money that regulates economic activity and the general level of interest rates. In a system of Real Money (Gold and Silver), it is the Money that regulates economic activity and the general level of interest rates.
World Bond markets move in a symphony. We have GLOBAL MARKETS. What happens in Greece directly reflects what happens in the USA, and the UK is a precursor of what will happen worldwide. History is being written. Bringing down interest rates and keeping them low is EXACTLY the opposite of what should be done. History repeatedly shows that the authorities are champions of doing the wrong thing at the right time. Ludwig Von Mises explains clearly that one must INCREASE interest rates to INCREASE SAVINGS, which are to be used for fundamentally sound INVESTMENTS. Authorities are doing precisely the opposite: low interest rates increased consumption and created the real estate bubble (dead capital), thereby debasing the savings of the Baby boomers. Today, Authorities do all they can to keep the rates down and the economy alive. It goes so far that the FED buys US treasuries as soon as other buyers fail. Low interest rates keep the rate of foreclosures low and troubled credit card companies alive. However, as explained by Ludwig von Mises, at a certain point, the market forces make the final decision. The longer interest rates are suppressed, the stronger they will veer up once the time has come. The chart below shows that European bonds have also reversed the trend. The earlier breakdown resulted in a false break, and we will now build a double Top. Authorities inject Trillions (Quantitative Easing) into the economy to keep it alive. We know this won't save the system from collapsing in the medium-term run. It NEVER did in the past, and it will not be today. A new boom can be initiated only after the misallocated funds have been cleaned out of the system! By artificially lowering interest rates, the authorities are doing nothing more than increasing the misallocation of funds. In the long run, interest rates |
 rise due to the inflationary policies of the authorities and banks,' and the latter adjust what we call 'the official interest rate' to the market conditions.
Total Debt:
 |
 |
| 2014 Total debt versus GDP | FED is insolvent |
 |
 |
| Sep. 2020 Total Debt | Oct 2021 Total Debt |
 |
 |
Per Capita debt Feb 2012

© - All Rights Reserved - The contents of this report may NOT be copied, reproduced, or distributed without the explicit written consent of Goldonomic