|
Updated September 29, 2011 - bullish formations -
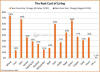
Our opinion:
- The day is close where we shall
see double top breakouts on most of the Point & Figures charts
below (Copper and the Reuters Commodity index already have) ...and
resistance will become support. That day will be the OFFICIAL
beginning of the hyperinflation cycle...AND THESE ARE THE DAYS
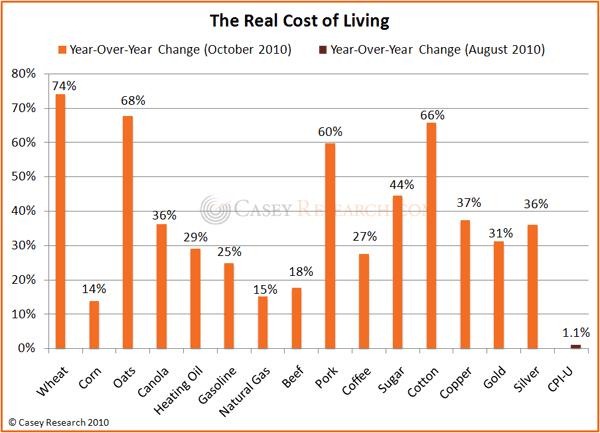
- Uh...no inflation? Who pretends
this... the price of Cotton and Coffee are exploding. The price of
rubber has gone up by 400%. Grains are next...and Cattle...
|
- Where are the Talking Heads
pretending we would see price deflation? First comes
hyperinflation, then deflation. The moving averages of almost all
commodities show positive cross-overs. Point and Figure charts
cascade reversals...Most commodity charts are preparing a Bull run
of at least 30% to 40%. This is a inflation and not a deflation
scenario! REAL ASSETS are booming and will continue to do so for
some time..... [exceptions are High Order Capital Goods - the
value of some goods will go up in nominal terms only]
- Authorities pretending we're
only seeing a temporary spike!? Absolutely NOT true.
- Expect the sliding dollar to
add fire to the inflation....
|
© -
Goldonomic, Florida, USA -
 +1
(772)-905-2491
+1
(772)-905-2491 |