|

Definitions:
-
Point-and-Figure charts probably
produce the most boring commentary for non-familiar readers to digest. Even
though they are not as exciting as momentum charts which can tell you almost
anything you want to hear, the advantage of point-and-figure analyses is that it
is the most objective type of technical analysis. One would be well served to
consider that more often than not, intermediate term investments that go against
the PF analysis lose money. These charts send out “buy” or “sell” signals and
there is no room for subjectivity. Although they are objective, as with any
other technical analysis method, they can be late or produce whipsaws. It is at
times such as this when PF charts are the most useful because they are clear,
objective, and unemotional. (While today’s markets are totally emotional.)
-
One of the characteristics of a Point &
Figure chart, is that it shows accumulation and distribution patterns.
The larger the distribution pattern, the bigger the subsequent potential move.
There are different ways to calculate
objectives. One is to measure the MAL (maximum activity line) and
multiply it by 2 or 3. This calculated distance is then set out on top or below
the MAL line.
-
A Bear Trap:
a false signal that
the rising trend of a stock or index has reversed when it has not.
-
A Bull Trap:
a false signal indicating
that a declining trend in a stock or index has reversed and is heading upwards
when, in fact, the security will continue to decline.
-
Dead Cat Bounce: a temporary recovery from a prolonged decline or
bear market, after which the market continues to fall.
-
Technical Correction: a decrease in the market price of an asset or
entire market after extensive price increases. A technical correction occurs
even when there is no evidence that the increasing price trend should cease.
-
A slingshot reversal is a reliable
trading pattern and is defined as a false breakout + reversal and occurs when a
major support or resistance point is broken but the price does not hold below
support or above resistance and moves back into it's previous trading range.
-
Shaven Head: applies to candle charts. A
bullish pattern during a downtrend & a bearish pattern during an uptrend.
-
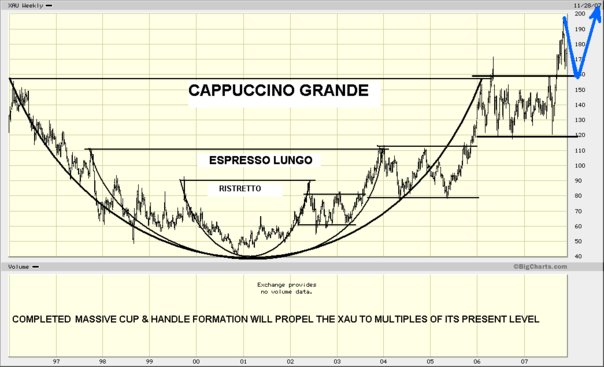
Cup and Handle and/or Multiple cup and Handle.
A strong reversal signal.
-
RSI (Relative Strength
Indicator) and (full) Stochastics can be excellent trend reversal
spotters. However, one must take into account that the RSI or Relative Strength
Index must be interpreted in a different way depending upon the cycle. In other
words, in a SECULAR BULL market, the RSI will seldom break below the 50
level. In a SECULAR BEAR MARKET, the RSI will seldom break above the
50 level. In other words, a RSI below the 50 level in a Bull Market is
a Buy signal and a RSI above the 50 level in a Bear Market is a Sell
signal. Stochastics show similar characteristics. In interpreting the
RSI, we note that bear markets are generally contained between the 60-20
levels on the indicator while bull markets will run generally between 80-40.
During a bull market, price
will run higher on strength, then experience a retracement during which it will
usually not exceed 30 on the downside level before moving back higher in the
direction of the longer term trend and going on to make new highs.
The opposite is true for a bear market. Price will
fall as selling pressure amplifies and take the RSI down to near the 20 level
only to experience a bout of short covering that takes the RSI back up to near
the 60 level before fresh selling takes over and another down leg commences.
-
The Moving Average
Convergence/Divergence (MACD) is one of the simplest and most reliable
indicators available. MACD uses moving averages, which are lagging indicators,
to include some trend-following characteristics. These lagging indicators are
turned into a momentum oscillator by subtracting the longer moving average from
the shorter moving average. MACD
centerline crossovers occur when the faster moving average crosses the slower
moving average and hereby generate a sell or a buy signal.
-
Divergences between the price evolution and
the RSI, Slow and Fast Stochastics are also important additional indicators.
There are POSITIVE and NEGATIVE divergences.
-
The Stochastic Oscillator
is a momentum indicator
that shows the location of the close relative to the
high-low range over a set number of periods. According to an interview with
Lane, the Stochastic Oscillator "doesn't follow price, it doesn't follow volume
or anything like that. It follows the speed or the momentum of price. As a rule,
the momentum changes direction before price." As such, bullish and bearish
divergences in the Stochastic Oscillator can be used to foreshadow reversals.
-
French Curves like Gold. A French curve is a mathematical
formula that works rather well on Gold and currencies. It acts as a long
term support line and at the same time it shows the (potential)
parabolic acceleration. A penetration of the French curve would
light up a caution sign.
-
Falling wedges are more
reliable technical patterns. The price tends to break out of the wedge
once 2/3rds of the wedge has been built.
-
A Golden Cross-over, or Positive
Cross-over is when the 50 Day Moving Average (50D), moves above the 200 Day
Moving Average (200D). When the fundamentals are supportive, the most bullish
phase in any stock or commodity is when the 50D has made a Golden Cross-Over and
the two moving averages (50D and 200D) are rising. The cross-over has to
be in synchronization with the fundamental direction, otherwise the trend will
be short-lived.
-
Head and Shoulder patterns
can sometimes be tricky. They can fail. However, when the pattern is
correct, the price objective is measured as the distance between the top and
the neck line.
>back to the top of the page
>back to Education Hall
© -
Goldonomic, Florida, USA -
 +1
(772)-905-2491
+1
(772)-905-2491 |